Via Andrew Gelman’s blog, summarizing an article by Ryan Streeter which summarizes some work by Joel Kotkin (have I mentioned everybody yet?) http://www.stat.columbia.edu/~cook/movabletype/archives/2010/03/demographics_an.html#comments we see a long term trend toward less mobility. “in 1970, 20 percent of Americans moved annually . . . by 2008, it dropped to 10 percent."
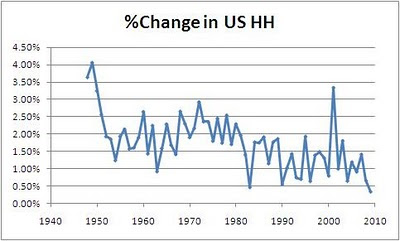
The rate of increase is the number of US households has changed as well. In the chart below, I show the yearly percent changes in number of households based on US Census Bureau data at www.census.gov/population/www/socdemo/hh-fam.html#ht
The rate after the end of World War II was predictably high. The rate then settles in at about 2% per year in the 1950s 1960s and 1970s (growing faster than the growth in population). Beginning in the 1980s there is a decline to about 1% annually (with a methodological spike in 2001due to changes in the CPS and incorporation of population controls from the 2000 census).
The current economic hard times have lowered household formation to a trickle -- +.34% for 2009 versus 2008.
There’s lots of room in the McMansions built during the housing boom. Might as well use all those spare bedrooms.

No comments:
Post a Comment