Why not subscribe?

Showing posts with label polls. Show all posts

Wednesday, November 09, 2016

What went wrong with the presidential polling pundits?

Prediction Overconfidence

As I write this, it is 5 a.m. November 9, 2016.  I got up to see if, perhaps, Clinton had pulled out an unlikely victory. She had not. Trump will be president.

The predictors did not do a good job. Here’s what I got when Googling the Huffington Post presidential prediction a few minutes ago (i.e. AFTER the election):

The Huffington modelers were outliers, but let’s look at what the major modeling groups said the day before the election[1]

New York Times: 84% chance Democrats will win the presidency
FiveThiryEight: 64%
Hufffington Post: 99%
PW: 89%
PEC: >99%
DK: 87%
Cook: Lean Dem
Rothenberg and Gonzales: Lean Dem
Sabato: Likely Dem

So where did they go wrong? Certainly there are difficulties in polling now, with nonresponse rates being very high.  Pew has done a series of studies using the same methodology over the years, so we can compare response rates[2]:

This makes it a challenge to adjust for these nonresponse rates, which are not random. I’d worried earlier that there might be some decent sized pocket of Trump voters who weren’t admitting they were Trump voters, because they thought that was a socially unpopular thing to do. That would technically be a bias, and the bias would be similar (correlated) across all states and polls.

And the results are likely to be within the margin of error of the individual polls. But, still, let’s not gloss over the fact that, in the end, there was a failure.

Oddly enough, this failure seems to me to be similar to the error in financial modeling that was one of the causes of the faulty risk assessments prior to the financial crisis in 2008, that led us into years of recession. That’s a failure to accurately measure the amount of intercorrelation.

I see an inkling of this in statistician and political scientist Andrew Gelman’s blog post election night[3]:

Election forecasting updating error: We ignored correlations in some of our data, thus producing illusory precision in our inferences

Posted by Andrew on
The election outcome is a surprise in that it contradicts two pieces of information: Pre-election polls and early-voting tallies. We knew that each of these indicators could be flawed (polls because of differential nonresponse; early-voting tallies because of extrapolation errors), but when the two pieces of evidence came to the same conclusion, they gave us a false feeling of near-certainty.
In retrospect, a key mistake in the forecast updating that Kremp and I did, was that we ignored the correlation in the partial information from early-voting tallies. Our model had correlations between state-level forecasting errors (but maybe the corrs we used were still too low, hence giving us illusory precision in our national estimates), but we did not include any correlations at all in the errors from the early-voting estimates. That’s why our probability forecasts were, wrongly, so close to 100%.
Put simply, if there is either a late surge for Trump in opinion, or there was a hidden batch of Trump supporters, or Trump supporters were more likely to show up to vote than expected by the models, these errors would not be random, they would be correlated. There would be more Trump votes across nearly ALL states.  Similarly, if Hillary supporters were less likely to show up to vote than expected, this would be likely to affect nearly ALL states, not occur randomly.

Note Gelman is aware of this problem, but doesn’t feel that he adjusted completely enough for it.

So how is this related to the financial crisis? Recall those mortgages that were packaged together, each with a certain probability of failing.  But each mortgage had, say, a 2% chance of failing, then a bundle of 1000 mortgages would have about 20 failing, with a 95% chance that the number will be between 12 and 28. But that’s if the mortgages failures were independent.  They aren’t.  Like Gelman in his note above, it was known that the mortgages weren’t independent and that a correlation needed to be estimated.  Felix Salmon, in his article “Recipe for Disaster: The Formula That Killed Wall Street”[4] notes that this estimation of the correlation by David X. Li using a Gaussian copula function
“looked like an unambiguously positive breakthrough, a piece of financial technology tha allowed hugely complex risks to be modeled with more easy and accuracy than ever before… His method was adopted by everybody from bond investors and Wall Street banks to ratings agencies and regulators. And it became so deeply entrenched – and was making people so much money – that warnings about its limitations were largely ignored.”
“Using some relatively simple math—by Wall Street standards, anyway—Li came up with an ingenious way to model default correlation without even looking at historical default data. Instead, he used market data about the prices of instruments known as credit default swaps…. When the price of a credit default swap goes up, that indicates that default risk has risen. Li's breakthrough was that instead of waiting to assemble enough historical data about actual defaults, which are rare in the real world, he used historical prices from the CDS market.”
But there’s a problem, as Salmon notes:
“The damage was foreseeable and, in fact, foreseen. In 1998, before Li had even invented his copula function, Paul Wilmott wrote that "the correlations between financial quantities are notoriously unstable." Wilmott, a quantitative-finance consultant and lecturer, argued that no theory should be built on such unpredictable parameters. And he wasn't alone. During the boom years, everybody could reel off reasons why the Gaussian copula function wasn't perfect. Li's approach made no allowance for unpredictability: It assumed that correlation was a constant rather than something mercurial. Investment banks would regularly phone Stanford's Duffie and ask him to come in and talk to them about exactly what Li's copula was. Every time, he would warn them that it was not suitable for use in risk management or valuation.

“In hindsight, ignoring those warnings looks foolhardy. But at the time, it was easy. Banks dismissed them, partly because the managers empowered to apply the brakes didn't understand the arguments between various arms of the quant universe. Besides, they were making too much money to stop.”
So, in both the election forecasting and in the financial forecasting of those tranched mortgage securities we have a problem in not accurately understanding the correlations (and the stability of the correlations) between events. There are a lot of differences, of course, but still those high level similarities.

And there is the human tendency to overconfidence in predictions, which has been amply demonstrated many times[5], including even in a survey of Messy Matters blog readers (who tend to be professional statisticians) taking part in a survey called “Are You Overconfident”![6]

“The bad news is that you’re terrible at making 90% confidence intervals. For example, not a single person had all 10 of their intervals contain the true answer, which, if everyone were perfectly calibrated, should’ve happened by chance to 35% of you. Getting less than 6 good intervals should, statistically, not have happened to anyone. How many actually had 5 or fewer good intervals? 76% of you.”

So, in both the financial collapse and in the 2016 election predictions we have an inability to accurately understand the correlation between events, combined with the bias toward overconfidence that seems to be a persistently human trait. 

Regardless of our posthac understanding, we still had a deep recession after the financial collapse and we will still have Donald Trump as president. So, there may be understanding, but there will also be pain.  Can we not have a gain in learning without pain?

I’m trying not to think about the more complex situation of climate models.


Fun Fact: Here's a surprising number. I downloaded the polls data from FiveThirtyEight (polls only forecast), and only looked at polls since Sept 1. The total sample size in these polls? 3,155,370 (these include polls done in states, mostly in swing states). That's a truly staggering number. So, while individual polls have a sampling error margin of error, the error in polling as a whole is due to nonsampling errors (most commonly summarized under the term "biases".


[1] Josh Katz, The Upshot, New York Times, 2016 Election Forecast: Who Will Be President, updated Monday Nov 7, 2016 6:58a.m.
[2] http://www.people-press.org/2012/05/15/assessing-the-representativeness-of-public-opinion-surveys/  accessed November 9, 2016. “Assessing the Representativeness of Public Opinion Surveys“ (May 16, 2012 report)
[4] Felix Salmon “Recipe for Disaster: The Formula That Killed Wall Street” Wired, February 23, 2009 https://www.wired.com/2009/02/wp-quant/ , accessed November 9, 2016.
[5] Mannes, A. and Moore, D. (2013), I know I'm right! A behavioural view of overconfidence. Significance, 10: 10–14. doi:10.1111/j.1740-9713.2013.00674.x
[6] Daniel Reeves “Are You Overconfident?” Messy Matters (blog) Sunday, February 2010 http://messymatters.com/calibration/ and results “Yes, You Are (Maybe) Overconfident”, Wednesday, March 31, 2010. http://messymatters.com/calibration-results/ (accessed November 9, 2016)

Sunday, January 13, 2013

33% Owe Less Money Than Last Year

A recent Rasmussen poll shows this one-in-three American adults (33%) now owe less money than they did a year ago.  39% owe about the same amount they did last year, while 26% owe more.

This doesn’t say how much more or less Americans owed, but still is a good sign that there might be some deleveraging of American households despite the weak economy since 2007.

It’s all in the presentation!

I note that the Rasmussen headline writer runs the numbers the other way:

image

Usually I’m a “glass half empty” kind of guy, but this time I’m more encouraged by the news than Rasmussen is.

Saturday, December 29, 2012

Eliminating deductions and the perils of voting

Rasmussen research reports 54% favor a specific proposal:

54% Favor 20% Cap on Income Tax If Deductions Are Ended

Friday, December 28, 2012

Most voters favor making the first $20,000 someone earns tax free and taxing income greater than $100,000 at a 20% rate in exchange for eliminating all their personal deductions.

A new Rasmussen Reports national telephone survey finds that 68% of Likely U.S. Voters support a proposal that would make the first $20,000 of income earned by anyone tax free. Just 19% are opposed, while 13% more are not sure. (To see survey question wording, click here.)

This is a noble try to figure out what people want / will accept / will tolerate. But it also illustrates some of the difficulties here.  It is hard to figure out whether such a proposal would be good or bad for the respondent. It’s hard for the respondent to figure out what the side effects would be.  [Note it would take a while for economists to try to estimate this.  One thing for sure: the real estate industry would be aghast at eliminating the mortgage interest deduction!]

Following MRA guidelines, Rasmussen provides an easy link to the question wording.  I’m going to microanalyze it below, NOT because I think I’m perfect and they aren’t, but just to bring out a couple of points.

Questions analyzed

First of all, the questions start out by saying these are all simplification proposals. Everybody who’s ever filed the long form is in favor of simplification of the filing process.

1* A proposal has been made to throw out the existing federal income tax code and replace it with a simpler system that has fewer deductions and lower tax rates. Thinking of all the issues facing the nation today, how important is it to replace the existing federal income tax code with something simpler?

So, we’re primed to like all the proposals which are “simpler”.

Next, we have two questions which imply that most of the respondents in the survey would have their taxes either unchanged or lowered. Question 3 has somebody else – somebody else richer – paying. As for question 4, really, at $20,000 now you are paying little income tax – maybe getting Earned Income credit. 

3* A proposal has been made that would reduce the personal income tax deductions for people who make more than $250,000 a year. Personal deductions would be completely eliminated for those who earn more than $400,000 a year. Would you favor or oppose this proposal?

4* A proposal has been made that would make the first $20,000 of income earned by anyone tax free. Would you favor or oppose this proposal?

So now with this positive setup, we have the relevant question:

5* A proposal has been made that would eliminate all tax deductions for upper income Americans and let everyone earn up to $20,000 a year tax free. After that, everyone would pay 10% in taxes on their first $50,000 in taxable income, 15% on income between $50,000 and $100,000, and 20% on all income over $100,000. If it raised the same amount of money as the current tax code, would you favor or oppose this proposal?

Within the confines of an understandable question, there’s only so much detail you can give, and there’s already a lot of detail in this question.  But note that tax deductions would be eliminated for all “upper income Americans”.  This always means people who are making more money than you!

So it’s likely that the respondents are looking at deductions being eliminated for other, richer people who can afford it.

Next, although it clearly says “all deductions”, I’ve found the curious idea in conversation with others that the mortgage interest deduction somehow isn’t seen as a deduction.  Personally, I favor eliminating the mortgage interest deduction because I think it distorts the housing market (making housing overall more expensive, and encouraging debt at a young age).  But maybe, just maybe, it’s because our own mortgage is paid off. Winking smile

9-9-9? Nein!

The worst example of this sort of confusion was the popularity of Herman Cain and his 9-9-9 plan – basically a plan to tax the rich less and the poor more, but definitely simpler.

So what’s the answer?

Yes, the answer probably is a simpler tax code with fewer preferences – to make it easier for people to file their own taxes (saving them money) and most importantly to enhance the perception of fairness in the system, for some definition of fairness.

If you don’t even understand the system, it’s hard to regard it as fair, by any definition.

Economists and politicians need to figure it out, and then sell it to citizens.  Polling is going to be extraordinarily difficult to do validly.

Sunday, October 02, 2011

Same number of Democrats and Republicans

Rasmussen reports that 33.9% consider themselves Republicans and 33.7% consider themselves Democrats. That’s the smallest difference seen in the 9 years  Rasmussen has been tracking this.

http://www.rasmussenreports.com/public_content/politics/mood_of_america/partisan_trends

So, we’re about 1/3 D, 1/3 R, and 1/3 Independent and other.  Not much consensus there.

Tuesday, September 08, 2009

Internet surveys reconsidered

Over at Pollster.com, Doug Rivers has a long post about survey bias and weighting.

http://www.pollster.com/blogs/doug_rivers.php

We're not talking about standard internet junk polls here, but ones that are actually trying to measure something. This is an increasing problem in the industry: people are much less willing to be surveyed, and the ones who are willing may not be the same as those who are not.

It's a great post if you are interested in this sort of thing, and there have to be at least a dozen people besides me who are. I think Rivers pays too much attention to matching demographics (and not enough to matching behavior), but then that's what he had to work with.

Wednesday, August 12, 2009

Telephone surveys will be dead

Jay Leve, CEO of polling firm SurveyUSA, says we are seeing “the tail end” of the life cycle of telephone surveys.

Leve, whose firm specialises in automated telephone polls using recorded voices, told the Joint Statistical Meetings in Washington DC last week that phone research “has proven to be an excellent method of data collection at the turn of the 21st century”, but that both live and recorded telephone surveys will not be able to survive for much longer.

“Ringing someone’s phone without warning and asking if they have 20 minutes to spend with you flies in the face of everything that’s going on in the world today”

There's more from Research Live here.

Good points. Survey research isn't that old, and it undergoes technological shifts every so often -- from face to face interviews to mail to phone via directories to random digit dialing, etc. Another paradigm shift is somewhere out there.

Sunday, May 10, 2009

You can learn a lot from garbage

A lot of sources are listed in this online poll. My first thought was "paper in the trash" when I saw "Refuse" as the last entry.

Friday, October 31, 2008

Bias in media presidential polls


Gelman's blog links to a paper on poll bias by Adleman and Schilling.

The key graphic is one one above. Relative to the Gallup and Rasmussen polls, Fox is consistently pro-McCain and CBS/New York Times and ABC/Washington Post are consistently pro-Obama. NBC/Wall Steet Journal are in the middle, and CNN displays a slight McCain bias.

Tuesday we'll have a better idea who's right.

Gelman notes:
"I guess this makes sense, given that these different news outlets want to make their readers happy. It still surprises me a bit–I thought all these pollsters were pros. It’s not that polling and poll adjustment are easy or automatic–a lot of subjective decisions still need to be made–but I’d think it would be possible to do this without being influenced by your political predilections or those of your audience."

Gelman's statement contains an assumption that the purpose of a media poll is accuracy. But the real purpose of media news is to attract an audience for commercial messages.

With that in mind,
It makes sense to provide messages that your audience will like better.
It makes sense for the polls not to be too stable -- an unstable polling method can provide news that "Obama is surging" one week, and that "McCain is coming back" the next.
It makes sense to provide results that the audience hasn't seen before, that are just surprising enough to allow a teaser for the late night news.

Tuesday, October 28, 2008

It's not a typo, it's a news story.

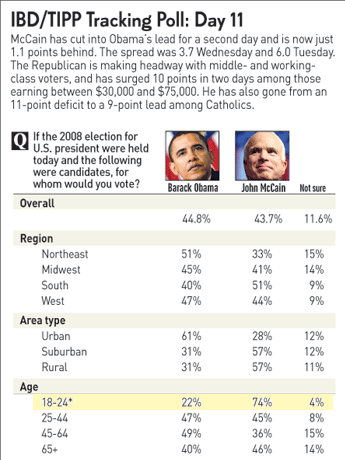
538.com notes this bit of stupidity in one of the polls they follow. This poll shows John McCain ahead 74% to 22% among 18 to 24 year olds.

One wonders about the general accuracy of any poll reporting this sort of stuff.


Note they show the race tight (1% apart) even though Obama is ahead in 3 of the 4 regions. And in two days McCain has gained 5 points, despite there being no big news this week? This whole poll looks like one big typo.

Wednesday, August 20, 2008

McCain now ahead ... or not

The mainstream media is having a field day with the news that a Zogby poll shows McCain now ahead of Obama. Of course, maybe this is just because I've been reading the Wall Street Journal lately.

Polling is interesting, in that polls done for the media really don't need to be very accurate, and in fact it is better for the media purchaser paying for the poll if they aren't very accurate. The "McCain ahead" numbers are getting such interest precisely because they are new information; otherwise they would just be one more poll showing Obama with a slight lead.

Pollster.com shows the Zogby poll of 1089 likely voters conducted August 14-16 with McCain ahead 46-41, but the Zogby poll of 3339 voters conducted August 12-14 with Obama ahead 44 to 42. Did you hear much publicity about THAT poll? No, because it wasn't "news". Other polls done at the same time continue to show Obama with a slight lead.

Andrew Gelman has some interesting charts showing that you can't tell much from polls done a few months before the election (remember president Dukakis?)

By the way, don't get me started on the whole "margin of error" business. What a joke that is!

Saturday, August 02, 2008

Not quite as religious as we tell people


The WSJ reports some work at Harvard that indicates people are less likely to make socially acceptable answers when they are interviewed by computer. They are more likely to make socially acceptable answers when interviewed by a person.

Good is Up

"A few doors down, Roger Tourangeau looks at ways people change their responses without always realizing it. The researcher in survey methodology was part of a University of Michigan and University of Maryland team studying what he calls "Good Is Up." If a word is listed at the top of a computer screen, more people are likely to assume it is positive, especially if they don't know its definition. In one test, he put "riboflavin" on a list of nutrients. When it was at the top of the screen, more people said it was good for them. When it was lower down, it was identified as less healthful."

[Thanks to Andrew Gelman's blog for directing me to this article.]