In our previous posts in this series, on package sizes and product sales, we found that Benford's Law (in which a first digit of 1 is more common than a first digit of 2, etc.) held for unit and dollar sales at the UPC-store-week level, but not when we aggregated further to the category-store-week level for two categories, beer and yogurt.
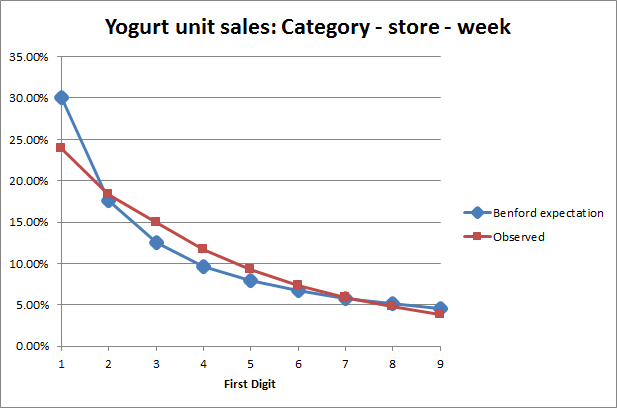
I've taken the earlier graphs for beer and yogurt and combined them so we have one graph for each category. The Benford's Law expectation is shown in the dashed blue line.
As we noted before, the first digits of units (UPC-store-week units) and dollars (UPC-store-week dollars) show a good fit. A UPC is a unique product with a specific Universal Product Code on the label, so it's very low level. When we aggregate up to category level, to sales of the entire product category, the fit isn't as good.

 I looked at two other categories in the IRI Marketing Data Set [7] to see if this pattern generalizes.
For household cleaners, we see a reversal. The UPC level has an excess of first digit 1s and 2s for units, which isn't surprising since these items tend to have low weekly movement. The dollars fit at the UPC level is good, but shows a bit of divergence.
The fit at the category level for both units and dollars is excellent.
 For frozen pizza, we see a result that's similar to beer and yogurt: the fit at the UPC level is good, but at the aggregate level has divergence.

I've taken the earlier graphs for beer and yogurt and combined them so we have one graph for each category. The Benford's Law expectation is shown in the dashed blue line.
As we noted before, the first digits of units (UPC-store-week units) and dollars (UPC-store-week dollars) show a good fit. A UPC is a unique product with a specific Universal Product Code on the label, so it's very low level. When we aggregate up to category level, to sales of the entire product category, the fit isn't as good.


For household cleaners, we see a reversal. The UPC level has an excess of first digit 1s and 2s for units, which isn't surprising since these items tend to have low weekly movement. The dollars fit at the UPC level is good, but shows a bit of divergence.
The fit at the category level for both units and dollars is excellent.


Does this mean anything?
There are some pretty graphs here, but do they mean anything?
The generalization from this analysis is that the degree of fit of actual data to Benford's Law is variable, and depends on the degree of aggregation. Aggregating the data to a higher level may produce a better fit. We found this with product sizes and with household cleaners. Or, it may degrade the fit. We found this with beer, yogurt and frozen pizza sales.
The degrading of fit when aggregation occurs is different from the degrading of fit when mixing occurs. [If we have 10 observations of A and 10 observations of B, we have 10 observations of aggregated A+B, but 20 observations of mixed A B.] The effect of mixing is understood [e.g. 1, appendix 3] but I need to look at more literature to understand the aggregation effect. It's a bit surprising, since the sales of the entire category tend to be much higher than the sales of individual products, and "As a rule, the more orders of magnitude that the data evenly covers, the more accurately Benford's law applies." [8] However, Benford's Law is more likely to apply when there are multiplicative fluctuations (numbers multiplied together) than additive fluctuations (numbers added together). [8]
The degrading of fit when aggregation occurs is different from the degrading of fit when mixing occurs. [If we have 10 observations of A and 10 observations of B, we have 10 observations of aggregated A+B, but 20 observations of mixed A B.] The effect of mixing is understood [e.g. 1, appendix 3] but I need to look at more literature to understand the aggregation effect. It's a bit surprising, since the sales of the entire category tend to be much higher than the sales of individual products, and "As a rule, the more orders of magnitude that the data evenly covers, the more accurately Benford's law applies." [8] However, Benford's Law is more likely to apply when there are multiplicative fluctuations (numbers multiplied together) than additive fluctuations (numbers added together). [8]
Benford's Law is mostly a curiosity, but is cited as one way to test for fraud. Examples of this are claimed in financial statements [1], Iranian elections [2,3,4,5,6] and other cases.
But we have to apply caution here. What fits in one context (e.g. one company) may not fit in another -- as we see here with household cleaners showing the opposite pattern from the other three categories.
In addition, there's the obvious implication that using Benford's Law patterns to test for fraud only works until the fraudsters get smarter.
[1] Amiram, Dan, Bozanic, Zahn and Rouen, Ethan. Financial statement errors: evidence from the distributional properties of financial statement numbers. Rev. Account Stud (2015) 20:1540-1593.
[2] Roukema, Boudewijn F. Benford's law anomalies in the 2009 Iranian presidential election. (2009) Submitted to the Annals of Applied Statistics.
http://arxiv.org/PS_cache/arxiv/pdf/0906/0906.2789v1.pdf
[3] Gelman, Andrew. Unconvincing (to me) use of Benford’s law to demonstrate election fraud in Iran. Blog post, June 17, 2009. http://andrewgelman.com/2009/06/17/unconvincing_to/
[4] Gelman, Andrew. Combining findings at the Province and County Level from Iran's Election. Blog post, June 20, 2009. http://andrewgelman.com/2009/06/20/combining_findi/
[5] Gelman, Andrew. The Devil is in the Digits. Blog post, June 20, 2009. http://andrewgelman.com/2009/06/20/the_devil_is_in/
[6] Beber, Beermd and Scacco, Alexandra. The Devil is in the Digits: Evidence That Iran's Election was Rigged. Washington Post, June 20, 2009 http://www.washingtonpost.com/wp-dyn/content/article/2009/06/20/AR2009062000004.html?hpid=opinionsbox1
[7] Bronnenberg, B. J., Kruger, M. W., & Mela, C. F. (2008). Database Paper—The IRI Marketing Data Set.Marketing Science, 27(4), 745–748. http://doi.org/10.1287/mksc.1080.0450
[8] Wikipedia, Benford's Law. Retrieved November 29, 2015. https://en.wikipedia.org/wiki/Benford%27s_law